前言
在上一篇中讲述了绘制折线图的方法,也较详细的讲述了宿主View、图表CPTXYGraph、绘图空间、坐标系、以及图例的创建过程。这一篇将主要简述柱状图(CPTBarPlot)的创建,以及一些不同点,其它的和上一篇相同。效果图如下: 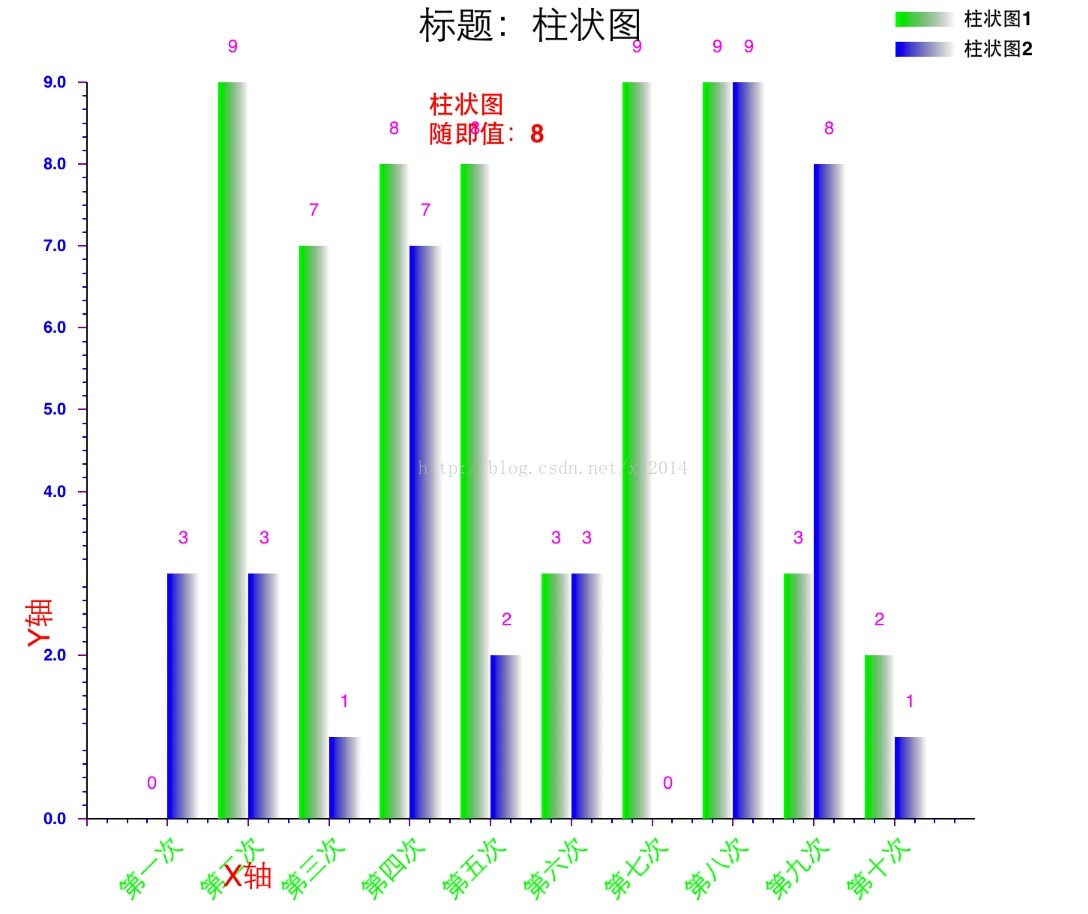
柱状图(CPTBarPlot)的创建
CPTBarPlot用于创建柱状图,继承于CPTPlot。
#pragma mark 创建平面图,柱状图
- (void)createPlots
{
    // 动画
    CABasicAnimation *fadeInAnimation = [CABasicAnimation animationWithKeyPath:@"opacity"];
    fadeInAnimation.duration            = 3.0f;
    fadeInAnimation.removedOnCompletion = NO;
    fadeInAnimation.fillMode            = kCAFillModeForwards;
    fadeInAnimation.toValue             = [NSNumber numberWithFloat:1.0];

    // 第一个柱状图
    {
        // 第一个参数指定渐变色的开始颜色,默认结束颜色为黑色,第二个参数指定是否绘制水平柱子。
        CPTBarPlot *barPlot = [CPTBarPlot tubularBarPlotWithColor:[CPTColor greenColor] horizontalBars:NO];

        // 添加图形到绘图空间
        [_hostView.hostedGraph addPlot:barPlot];

        // 设置数据源 实现CPTBarPlotDataSource委托
        barPlot.dataSource = self;

        // 委托事件
        barPlot.delegate = self;

        // 标识,根据此@ref identifier来区分不同的plot,也是图例显示名称,
        barPlot.identifier = @"BarPlot1" ;

        // 基线值设置
        {
            // NO:@ref baseValue的设置对所有的柱子生效,YES:需要通过数据源设置每一个柱子的@ref baseValue  默认值:NO
            barPlot.barBasesVary = YES;
            // 柱子的基线值 @ref barBasesVary为NO时才会生效,否则需要在数据源中设置枚举为CPTBarPlotFieldBarBase的一个适当的值
            // 柱子都是从此基线值处开始绘制,相当于原点
            barPlot.baseValue = CPTDecimalFromFloat(1);
        }

        // 柱子设置,柱子的实际宽度为@ref barWidth * barWidthScale
        {
            // 宽度计算方式 NO:1主刻度长度=1宽度  YES:1像素=1宽度  默认值:NO
            barPlot.barWidthsAreInViewCoordinates = YES;
            // 宽度
            barPlot.barWidth = CPTDecimalFromCGFloat(20);
            // 柱宽的缩放系数
            barPlot.barWidthScale = CPTFloat(1);
            // 开始绘制的偏移位置,默认为0,表示柱子的中间位置在刻度线上
            barPlot.barOffset = CPTDecimalFromCGFloat(-10) ;
            // 尖端的圆角值 用的是像素单位
            barPlot.barCornerRadius = CPTFloat(0);
            // 底部的圆角值,基线值的圆角 用的是像素单位
            barPlot.barBaseCornerRadius = CPTFloat(0);
            // 外框的线型 默认:黑色 宽度1
            barPlot.lineStyle = nil;
            // 填充色
            CPTGradient *gradient = [CPTGradient gradientWithBeginningColor:[CPTColor greenColor] endingColor:[CPTColor clearColor]];
            CPTFill *fill = [CPTFill fillWithGradient:gradient];
            barPlot.fill = fill;
        }

        // 数据标签设置,如果想用自定义的标签,则需要数据源方法:dataLabelForPlot:recordIndex:
        {
            // 偏移量设置
            barPlot.labelOffset = 15;
            // 数据标签样式
            CPTMutableTextStyle *labelTextStyle = [[CPTMutableTextStyle alloc] init];
            labelTextStyle.color = [CPTColor magentaColor];
            barPlot.labelTextStyle = labelTextStyle;
        }

        // 添加动画
        barPlot.opacity = 0.f;
        [barPlot addAnimation:fadeInAnimation forKey:@"animateOpacity"];

    }

    // 第2个柱状图
    {
        // 第一个参数指定渐变色的开始颜色,默认结束颜色为黑色,第二个参数指定是否绘制水平柱子。
        CPTBarPlot *barPlot = [CPTBarPlot tubularBarPlotWithColor:[CPTColor blueColor] horizontalBars:NO];

        // 添加图形到绘图空间
        [_hostView.hostedGraph addPlot:barPlot];

        // 设置数据源 实现CPTBarPlotDataSource委托
        barPlot.dataSource = self;

        // 标识,根据此@ref identifier来区分不同的plot,也是图例显示名称,
        barPlot.identifier = @"BarPlot2" ;

        // 基线值设置
        {
            // NO:@ref baseValue的设置对所有的柱子生效,YES:需要通过数据源设置每一个柱子的@ref baseValue  默认值:NO
            barPlot.barBasesVary = NO;
            // 柱子的基线值 @ref barBasesVary为NO时才会生效,否则需要在数据源中设置枚举为CPTBarPlotFieldBarBase的一个适当的值
            // 大于这个值以上的点,柱子只从这个点开始画。小于此值的点,则是反向绘制的,即从基线值向下画,一直画到到数据点。
            barPlot.baseValue = CPTDecimalFromFloat(0);
        }

        // 柱子设置
        {
            // 宽度计算方式 NO:1主刻度长度=1宽度  YES:1像素=1宽度  默认值:NO
            barPlot.barWidthsAreInViewCoordinates = NO;
            // 宽度
            barPlot.barWidth = CPTDecimalFromCGFloat(0.4);
            // 柱宽的缩放系数
            barPlot.barWidthScale = CPTFloat(1);
            // 开始绘制的偏移位置
            barPlot.barOffset = CPTDecimalFromCGFloat(0.2) ;
            // 尖端的圆角值 用的是像素单位
            barPlot.barCornerRadius = CPTFloat(0);
            // 底部的圆角值,基线值的圆角 用的是像素单位
            barPlot.barBaseCornerRadius = CPTFloat(0);
            // 外框的线型 默认:黑色 宽度1
            barPlot.lineStyle = nil;
            // 填充色
            CPTGradient *gradient = [CPTGradient gradientWithBeginningColor:[CPTColor blueColor] endingColor:[CPTColor clearColor]];
            CPTFill *fill = [CPTFill fillWithGradient:gradient];
            barPlot.fill = fill;
        }

        // 数据标签设置,如果想用自定义的标签,则需要数据源方法:dataLabelForPlot:recordIndex:
        {
            // 偏移量设置
            barPlot.labelOffset = 15;
            // 数据标签样式
            CPTMutableTextStyle *labelTextStyle = [[CPTMutableTextStyle alloc] init];
            labelTextStyle.color = [CPTColor magentaColor];
            barPlot.labelTextStyle = labelTextStyle;
        }

        // 添加动画
        barPlot.opacity = 0.f;
        [barPlot addAnimation:fadeInAnimation forKey:@"animateOpacity"];
    }
}
CPTBarPlot的数据源方法CPTBarPlotDataSource
#pragma mark 询问有多少个数据
- (NSUInteger)numberOfRecordsForPlot:(CPTPlot *)plot
{
    NSUInteger count = 0;
    if ([plot.identifier isEqual:@"BarPlot1"]) {
        count = self.dataSource1.count;
    }else {
        count = self.dataSource2.count;
    }

    return count;
}

#pragma mark 询问一个个数据值 fieldEnum:一个轴类型,是一个枚举  idx:坐标轴索引
- (NSNumber *)numberForPlot:(CPTPlot *)plot field:(NSUInteger)fieldEnum recordIndex:(NSUInteger)idx
{
    NSNumber *num = nil;

    if ([plot.identifier isEqual:@"BarPlot1"]) {
        switch (fieldEnum) {
            case CPTBarPlotFieldBarLocation:    // 柱子所处位置 如果是垂直柱子,即为x轴的位置
            {
                num = @(idx + 1);
            }
                break;
            case CPTBarPlotFieldBarTip:         // 柱子尖端位置(柱子的长度) 如果是垂直柱子,即为y轴的位置
            {
                num = self.dataSource1[idx];
            }
                break;
            case CPTBarPlotFieldBarBase:        // 柱子的基线值 只有@ref barBasesVary = YES 时才会用到该枚举
            {
                num = @(0);
            }
                break;
            default:
                break;
        }
    }else if ([plot.identifier isEqual:@"BarPlot2"]){
        switch (fieldEnum) {
            case CPTBarPlotFieldBarLocation:    // 柱子所处位置 如果是垂直柱子,即为x轴的位置
            {
                num = @(idx + 1);
            }
                break;
            case CPTBarPlotFieldBarTip:         // 柱子末端位置(柱子的长度) 如果是垂直柱子,即为y轴的位置
            {
                num = self.dataSource2[idx];
            }
                break;
            case CPTBarPlotFieldBarBase:        // 柱子的基线值 只有@ref barBasesVary = YES 时才会用到该枚举
            {

            }
                break;
            default:
                break;
        }
    }
    return num;
}

#pragma mark 添加数据标签
- (CPTLayer *)dataLabelForPlot:(CPTPlot *)plot recordIndex:(NSUInteger)idx
{
    if ([plot.identifier isEqual:@"BarPlot1"]) {
        // 数据标签样式
        CPTMutableTextStyle *labelTextStyle = [[CPTMutableTextStyle alloc] init];
        labelTextStyle.color = [CPTColor magentaColor];

        // 定义一个 TextLayer
        CPTTextLayer *newLayer = [[CPTTextLayer alloc] initWithText:[NSString stringWithFormat:@"%d",(int)[self.dataSource1[idx] integerValue]] style:labelTextStyle];

        return newLayer;
    }else {
        // 数据标签样式
        CPTMutableTextStyle *labelTextStyle = [[CPTMutableTextStyle alloc] init];
        labelTextStyle.color = [CPTColor magentaColor];

        // 定义一个 TextLayer
        CPTTextLayer *newLayer = [[CPTTextLayer alloc] initWithText:[NSString stringWithFormat:@"%d",(int)[self.dataSource2[idx] integerValue]] style:labelTextStyle];

        return newLayer;
    }
}

#pragma mark 设置图例名称 返回每一个柱子的图例名称 返回nil则不显示该索引下的图例
- (NSString *)legendTitleForBarPlot:(CPTBarPlot *)barPlot recordIndex:(NSUInteger)idx
{
    NSString *legendTitle = nil;
    if ([barPlot.identifier isEqual:@"BarPlot1"]) {
        legendTitle = [NSString stringWithFormat:@"柱状图1-%d",idx];
    }else {
        legendTitle = [NSString stringWithFormat:@"柱状图2-%d",idx];
    }
    return legendTitle;
}
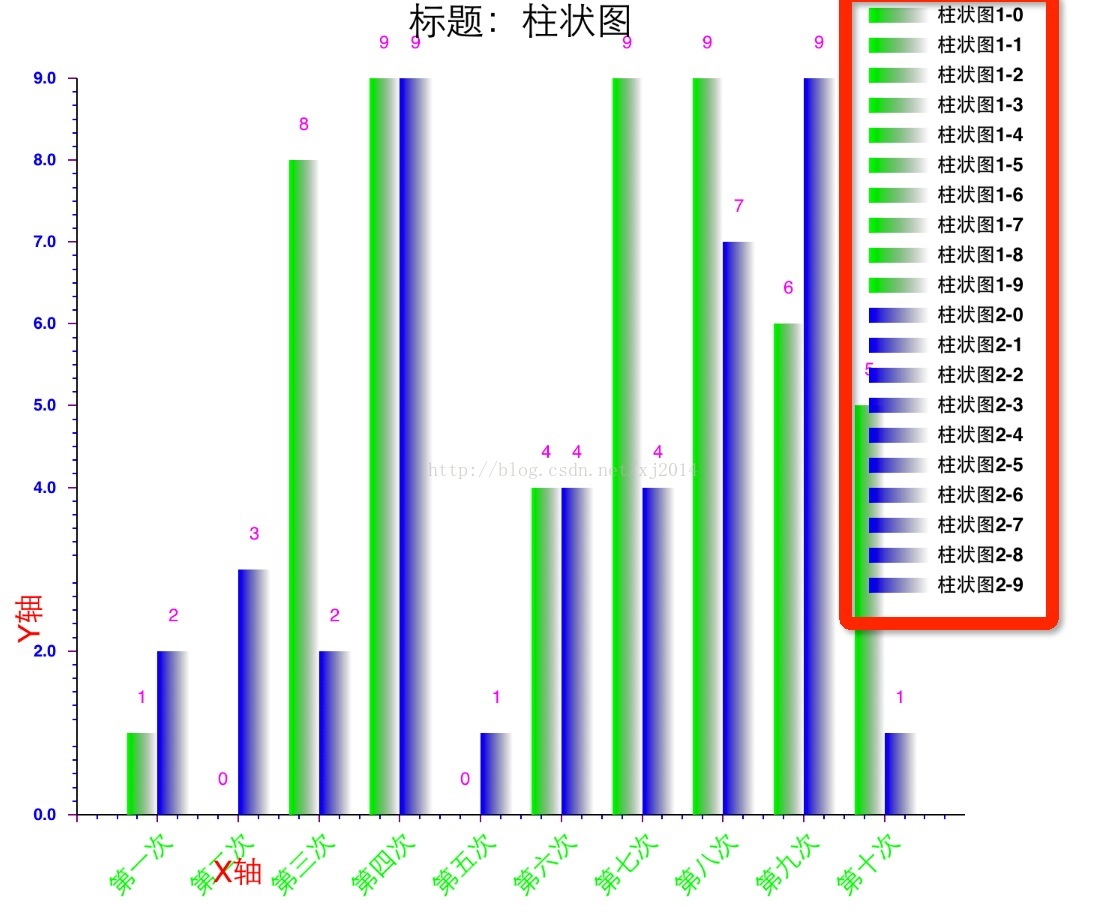
如果想使用数据源方法设置图例方法,必须要用如下方法创建图例,这会使每一个柱子都在图例中。
CPTLegend *legend = [CPTLegend legendWithPlots:_hostView.hostedGraph.allPlots];
CPTLegend *legend = [CPTLegend legendWithGraph:_hostView.hostedGraph]
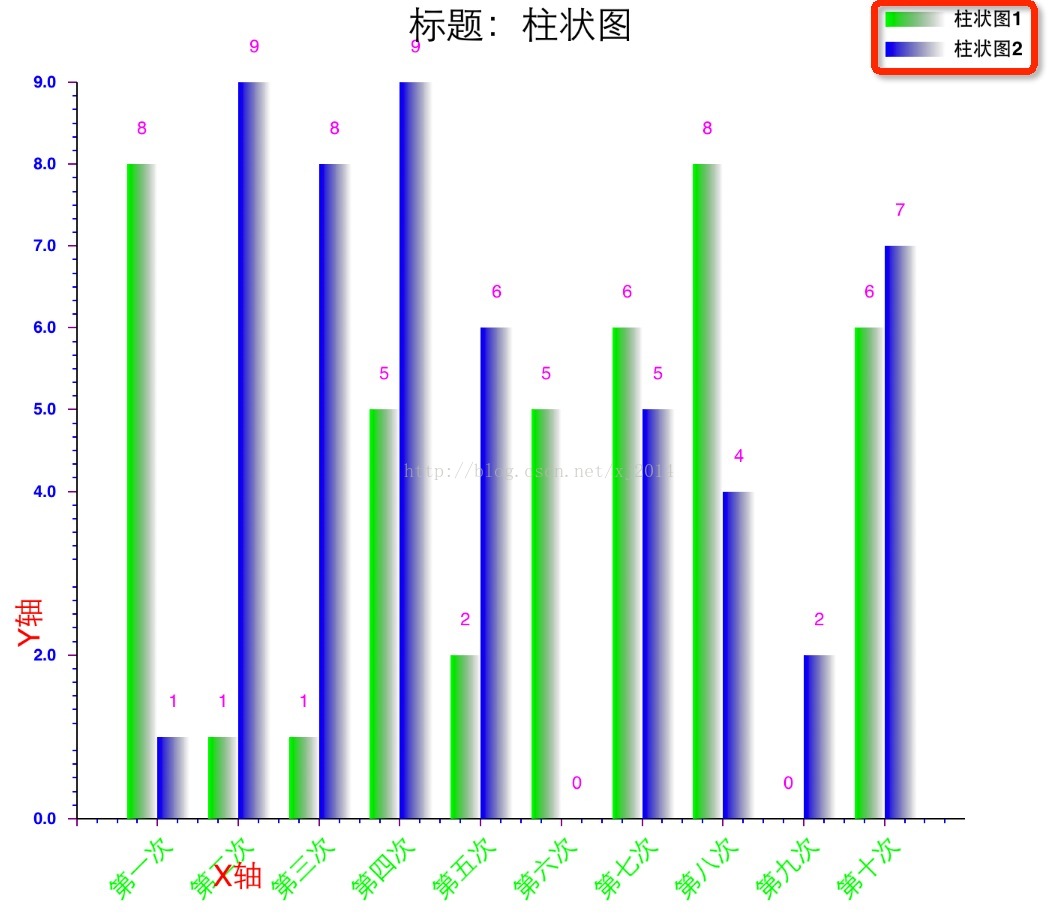
如果不需要每个柱子都显示图例(不会调用数据legendTitleForBarPlot),只需要设置不同类别的图例,可以使用如下方法。
// 图例样式设置
NSMutableArray *plots = [NSMutableArray array];
for (int i = 0; i < _hostView.hostedGraph.allPlots.count; i++) {
    CPTBarPlot *barPlot = _hostView.hostedGraph.allPlots[i];

    CPTBarPlot *plot = [[CPTBarPlot alloc] init];
    plot.fill = barPlot.fill;
    plot.lineStyle = barPlot.lineStyle;
    plot.identifier = [NSString stringWithFormat:@"柱状图%d", (i + 1)];
    [plots addObject:plot];
}
// 图例初始化 只有把plots 替换为 _hostView.hostedGraph.allPlots 数据源方法的设置图例名称才会生效
CPTLegend *legend = [CPTLegend legendWithPlots:plots];
两种创建图例的方法效果如下:
CPTBarPlot的delegate方法
#pragma mark 选中某个柱子的操作 添加注释
- (void)barPlot:(CPTBarPlot *)plot barWasSelectedAtRecordIndex:(NSUInteger)idx withEvent:(UIEvent *)event
{
    // 移除注释
    CPTPlotArea *plotArea = _hostView.hostedGraph.plotAreaFrame.plotArea;
    [plotArea removeAllAnnotations];

    // 创建注释,plotSpace:绘图空间 anchorPlotPoint:坐标点
    CPTPlotSpaceAnnotation *barTextAnnotation = [[CPTPlotSpaceAnnotation alloc] initWithPlotSpace:_hostView.hostedGraph.defaultPlotSpace anchorPlotPoint:@[@(idx + 1),self.dataSource1[idx]]];

    // 文本样式
    CPTMutableTextStyle *annotationTextStyle = [CPTMutableTextStyle textStyle];
    annotationTextStyle.color = [CPTColor redColor];
    annotationTextStyle.fontSize = 17.0f;
    annotationTextStyle.fontName = @"Helvetica-Bold";
    // 显示的字符串
    NSString *randomValue = [NSString stringWithFormat:@"柱状图\n随即值:%@ \n", [self.dataSource1[idx] stringValue]];
    // 注释内容
    CPTTextLayer *textLayer = [[CPTTextLayer alloc] initWithText:randomValue style:annotationTextStyle];
    // 添加注释内容
    barTextAnnotation.contentLayer = textLayer;

    // 注释位置
    barTextAnnotation.displacement = CGPointMake(CPTFloat(0), CPTFloat(20));

    // 把拐点注释添加到绘图区域中
    [plotArea addAnnotation:barTextAnnotation];
}